How to use Power Table
Power Table lets you build the exact performance table you need. Choose the information that should define each row, choose the numbers you want to compare, and Power Table organizes the results automatically.
Open Analytics → Power Table to get started.
Choose one of the Quick layouts, such as By Book Title or By Author, and then adjust its columns. You do not need to build every table from scratch.
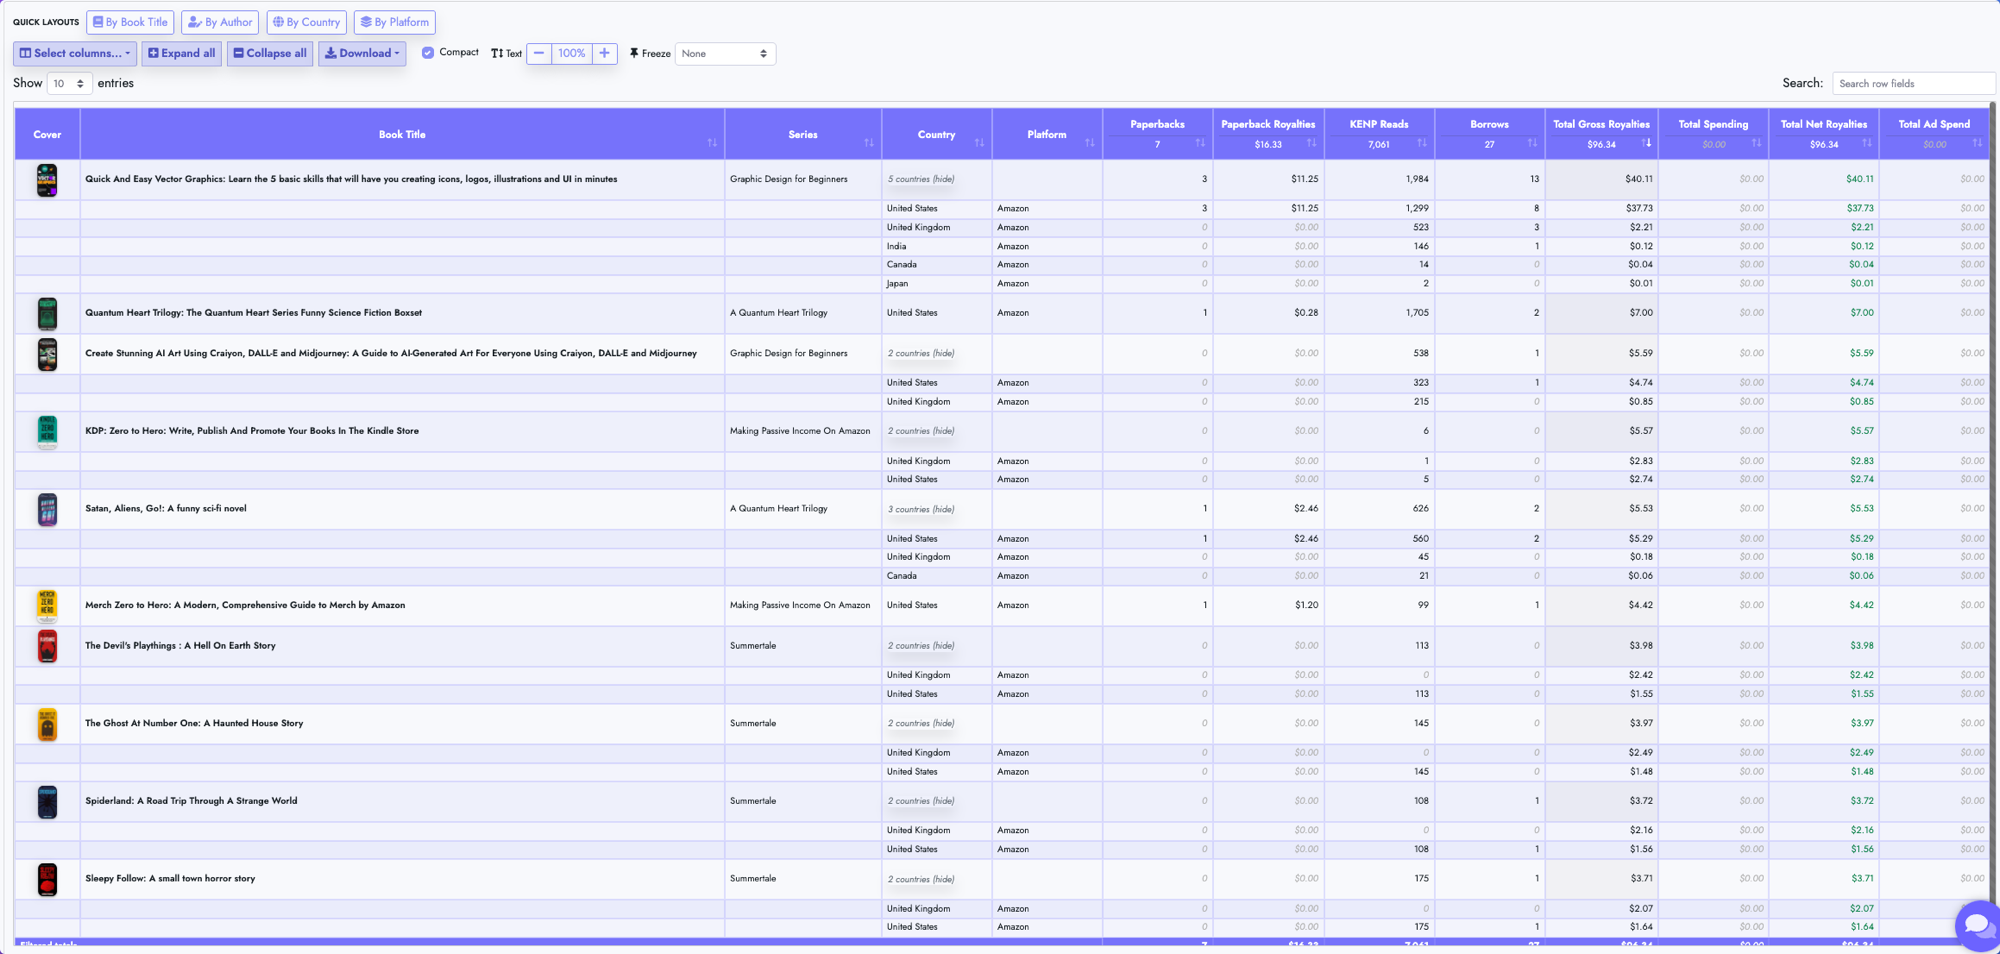
The two types of columns
Power Table has two simple column types:
| Column type | What it does | Examples |
|---|---|---|
| Attributes | Decide how the data is grouped and nested | Book Title, Author, Series, Book Tags, Country, Platform, Book Format, Month and Year |
| Metrics | Show the numbers or metadata for each group | Total Gross Royalties, Total Paid Units, Royalty per Unit, Total Spending, Sell-Through, Read-Through, Royalties per Reader, RPR Contribution, ROI, ROAS, BSR |
Think of attributes as the question and metrics as the answer.
Total Spending combines AMZ Spend + FB Spend + BookBub Spend + External Expenses into one column. The individual spending columns remain available when you need to see the breakdown.
For example:
- Book Title → Country asks: “How did each title perform in each country?”
- Author → Book Title → Month and Year asks: “How did each author's books perform over time?”
- Book Tags → Book Title asks: “How did the books in each tag perform?”
Build a table in three steps
1. Apply the page filters
Use the filters above the table to choose the data Power Table should include:
- Select a Time Period.
- Add any extra filters you need, such as Book Titles, Authors, Series, Book Formats, Book Tags, Countries, or Platforms.
- Click Apply filters.
Filters limit the source data before the table groups or calculates it. This is useful when you want to study one launch, one pen name, one series, one country, or one sales platform.
If you have Shared Access, use the account selector at the top of the page first. Power Table only includes the selected accounts and always follows the author and book restrictions granted by each account owner.
The Account attribute is only available when someone has Shared Access with you.
2. Select attributes and metrics
Click Select columns….
- Use the search box to search Attributes and Metrics together. You do not need to open a section before searching.
- Tick an attribute or metric to add it.
- Untick it to remove it.
- Drag selected items to change their order.
- Close the dropdown when you are finished.
Metrics are separated by simple headers—Overview, Book Formats, Kindle Unlimited, Other Royalties, Spending, Advertising, Series, and Profitability—so you can scan the list more quickly. These headers do not create extra table levels and do not need to be opened or closed.
The table reloads once after the dropdown closes. This lets you make several changes without waiting after every click.
Your current unsaved setup is remembered in this browser, so it returns after a refresh. Use Saved layouts when you want a named setup available on your other browsers and devices.
3. Put attributes in the order you want to read them
Attribute order defines the table hierarchy from left to right.
For this order:
- Book Title
- Author
- Month and Year
Power Table first shows book titles. If a title contains multiple author or month values, those values can appear as nested rows beneath it.
You do not need to configure separate pivot levels. Add the attributes in the order you want, and Power Table handles the nesting.
Place your broadest attribute first and your most detailed attribute last.
- Good: Author → Book Title → Month and Year
- Good: Series → Book Title → Country
- Good: Platform → Country → Book Format
Use the Quick layouts
The Quick layouts create familiar tables with one click:
- By Book Title — compare individual books and show covers.
- By Author — compare authors or pen names.
- By Country — compare geographic markets.
- By Platform — compare Amazon, Apple Books, Kobo, Shopify, and other connected sources.
After selecting a Quick layout, you can still add, remove, or reorder any attribute or metric.
Save and reuse your own layouts
Once the table looks the way you want, save it for later:
- Open Saved layouts beside the Quick layouts.
- Select Save current layout....
- Enter a clear name, such as Monthly author review or Advertising by title.
- Select Save layout.
To use it again, open Saved layouts and select its name. Power Table applies the complete table setup and reloads the results once.
A saved layout remembers:
- Attributes, metrics, and their order
- Sorting
- Whether percentage shares are shown
- The number of rows shown per page
Date ranges and page filters are not included. This lets you reuse the same layout with a different period, author, title, account, or platform selection.
Select a layout's name to use it. Open its three-dot menu when you need to manage it:
- Select Update to replace that saved layout with the table currently on screen. Power Table asks for confirmation first and keeps the existing layout name.
- Select Rename to change only its name.
- Select Delete to remove it. Deleting a saved layout does not change the table currently on screen.
For example, load Monthly author review, add BSR and Country, reorder the metrics, and then select Update beside Monthly author review. The revised setup will be available under the same name on your other devices.
Saving another layout with the same name also replaces the saved setup. Layout names are normalized before saving: invisible and control characters are removed, unsafe angle brackets are stripped, Unicode is normalized, and repeated spaces are collapsed. Names are limited to 60 characters and duplicate names are handled explicitly.
Named layouts are saved securely to your Publisher Champ account. They appear when you sign in from another supported browser or device. Layouts contain table configuration only; they do not store performance rows or reporting data.
Layouts created before account-based saving was introduced are moved from the current browser to your account automatically the next time Power Table loads.
Expand and collapse nested results
When an attribute has multiple values, use its show control to open that branch.
- Expand all opens the nested rows for the current page in one request.
- Collapse all returns to the top-level groups.
- Opening one row only expands that branch.
If a group has only one value at the next level, Power Table keeps the table compact instead of adding an unnecessary duplicate-looking row.
Use a narrower date range or apply a Book Title, Author, Series, Tag, Country, or Platform filter before expanding a very broad table. This makes the table faster and easier to read.
Refresh the table
Select Refresh beside the expansion controls to reload Power Table with the current page filters, columns, sorting, search, pagination, and compatible expanded rows.
Use this if a temporary connection or reporting error prevents the table from loading. The refresh icon spins and the button is disabled while the new request is running, preventing duplicate reloads. Refreshing does not reset or replace the current layout.
Sort any attribute or metric
Select a column heading to sort it.
- Select the same heading again to reverse the direction.
- Sorting an attribute controls that nested level.
- Sorting a metric ranks groups by that number.
Examples:
- Sort Total Gross Royalties from highest to lowest to find your top performers.
- Sort Month and Year in ascending order to read a timeline.
- Sort Total Net Royalties to find the most or least profitable groups.
- Sort Ad Orders to compare advertising results.
- Sort BSR from lowest to highest to put the strongest current Amazon rank first. Rows without a recorded rank appear after ranked rows.
The total displayed beneath a metric heading covers all data matching the applied filters and search—not only the visible pagination page.
Number in Series and BSR are exceptions. They describe book metadata rather than quantities that can be added, so they do not display header or footer totals.
Reorder columns directly from the table
Drag the grip in the upper-left corner of a table heading to move that column:
- Drag an attribute heading to change the row and pivot order. For example, moving Country before Book Title changes Book Title → Country into Country → Book Title.
- Drag a metric heading to change where that number appears without changing the row hierarchy.
Attributes stay together on the left and metrics stay together on the right, so a number cannot accidentally become a pivot field. Power Table reloads once after the column is dropped. Column widths and applicable sorting follow their columns.
Use the dedicated grip for moving, the heading text or sorting arrows for sorting, and the right edge of a heading for resizing.
Understand the calculated metrics
Sell-Through
Sell-Through compares a book's unit sales with the preceding available book in the same series:
Current series position units ÷ Previous series position units × 100
For example, if Book 1 sold 100 eligible units and Book 2 sold 75, Book 2's Sell-Through is 75%.
Sell-Through includes paid ebooks, paperbacks, expanded distribution, and hardcovers. When Include free ebooks is enabled, free ebooks are included too. Audiobooks, KENP pages, and estimated Borrows are not part of Sell-Through.
When Sell-Through is selected, use the Include free ebooks toggle above the table to choose whether free ebook units should affect the calculation. Changing the toggle reloads the table with the selected rule, and saved layouts remember the setting.
Power Table uses the previous available Number in Series, not simply the previous title displayed in the table. If a series contains books numbered 1 and 3, book 1 is used as the comparison for book 3. If legacy metadata gives one book more than one series number, Power Table uses the lowest number deterministically.
Read-Through
Read-Through compares estimated complete Kindle Unlimited reads with the preceding available book in the same series:
Current estimated full reads ÷ Previous estimated full reads × 100
Estimated full reads are based on KENP pages read and the book's stored KENPC. For example, if Book 1 has 100 estimated full reads and Book 2 has 60, Book 2's Read-Through is 60%.
Sell-Through and Read-Through can be higher than 100%. A result of 900% means the current book recorded nine times the eligible units or estimated full reads of the preceding book for that exact table bucket. It is not capped at 100%.
Listen-Through
Listen-Through compares audiobook units with the preceding available audiobook edition in the same series:
Current audiobook units ÷ Previous audiobook edition units × 100
Only audiobook units participate. If a series position does not have an audiobook edition, Power Table skips it when finding the previous audiobook comparison. A zero value can mean either zero progression or that the active bucket has no usable earlier audiobook denominator.
Listen-Through is an aggregate unit-based progression estimate. It does not verify that identified customers completed an audiobook.
Power Table calculates series metrics inside the selected filters and attributes. A United States row compares both books using United States activity; an all-country row compares both books using all included countries. Country, Platform, Book Format, date, tag, account, and other active breakdowns can therefore produce different percentages.
Filtering the visible table to one title does not remove the authorized preceding series book from the private calculation reference. That reference is used only for the calculation and is never added to rows, totals, pagination, search results, or downloads.
Royalties per Reader and RPR Contribution
Royalties per Reader (RPR) estimates the royalties generated by a reader who enters at Book #1 and continues through the series. It is also known as Earnings per Reader (EPR):
RPR = eligible Book and KU royalties from Book #1 onward ÷ Book #1 estimated readers
Estimated readers are included units plus whole KU borrows. Power Table floors fractional KU borrows per book, uses the Include free ebooks toggle, always starts from Book #1, and does not exclude mid-series starters. A series without a usable Book #1 returns zero. Royalties on books with zero estimated readers are excluded.
Use Royalties per Reader with the Series dimension for the full series value. Use RPR Contribution with Book Title or ASIN to see each book's exact portion:
Book RPR Contribution = that book's eligible royalties ÷ Book #1 estimated readers
When a row groups several series, Power Table weights the result by Book #1 reader counts instead of averaging the series RPR values.
Number in Series
Number in Series displays the book's series position. Use it with Series → Book Title to check reading order or sort books into sequence.
If a book has more than one stored series number, Power Table displays the lowest one. Because a series number is descriptive rather than additive, the Number in Series column intentionally has no header or footer total.
BSR
BSR means Amazon Best Sellers Rank. Add it from the Metrics list when you want to compare the latest positive Amazon rank Publisher Champ has recorded for each book.
Lower is better. For example, #2,000 is a stronger rank than #30,000.
When Country is not part of the table hierarchy, the BSR cell displays each available marketplace as its own Amazon-yellow pill, such as:
- US: #30,000
- UK: #12,500
- DE: #8,400
When Country is part of the hierarchy, each Country row displays only the BSR belonging to that country. A United States row does not display or use the United Kingdom rank.
Book formats also remain separate. If an ebook, paperback, and hardcover have different ASINs and different ranks, a Book Format row uses only the rank belonging to that exact edition:
- An EBook row uses the ebook ASIN's BSR.
- A Paperback row uses the paperback ASIN's BSR.
- A Hardcover row uses the hardcover ASIN's BSR.
This remains true regardless of whether you use Book Title → Country → Book Format or Book Title → Book Format → Country.
BSR is the latest rank recorded in Publisher Champ. It is not calculated from sales in the selected Time Period. Changing the date range can change which performance rows are present, but it does not turn BSR into a historical rank for that period.
If no positive rank has been recorded for a book and marketplace, Power Table displays no BSR for that marketplace. Missing ranks are placed after ranked rows when sorting from lowest to highest.
An Author, Series, Tag, or other group can contain several books. In that situation, Power Table displays the lowest current BSR available in each marketplace for the books contributing to that group. Expand to Book Title or Book Format when you need the individual edition's rank.
BSR is descriptive, so its header and footer totals are intentionally blank.
ROI
ROI shows the return relative to all recorded spending:
(Total Gross Royalties − Total Spending) ÷ Total Spending × 100
For example, $300 in gross royalties and $100 in Total Spending produces an ROI of 200%.
ROAS
ROAS shows gross royalties for each unit of recorded spending:
Total Gross Royalties ÷ Total Spending
For example, $300 in gross royalties and $100 in Total Spending produces a ROAS of 3.00, meaning $3 in gross royalties for every $1 recorded as spending.
In Power Table, Total Spending includes AMZ Spend, FB Spend, BookBub Spend, and External Expenses. ROI and ROAS therefore use the same complete spending value shown in the table. If Total Spending is zero, Power Table displays zero rather than dividing by zero.
TACoS
TACoS follows the Ads Monitoring calculation and shows spending as a percentage of actual gross earnings:
Total Spending ÷ Total Gross Royalties × 100
For example, $100 in Total Spending and $500 in Total Gross Royalties produces a TACoS of 20%. Power Table recalculates TACoS from the totals in each row or nested group instead of averaging child percentages. If Total Gross Royalties is zero, it displays zero.
- Use ROI when you want profit after recorded spending expressed as a percentage of that spending.
- Use ROAS when you want a simple gross-royalty-to-spending multiple.
- Add Total Gross Royalties, Total Spending, and Total Net Royalties beside either metric so the values behind the calculation remain visible.
Royalty per Unit
Royalty per Unit shows the average gross royalty earned for each paid unit in the current row:
Total Gross Royalties ÷ Total Paid Units
Total Paid Units include Paperbacks, Expanded Distribution, Hardcovers, Paid Ebooks, Audiobooks, and estimated Borrows. Free Ebooks are excluded. The result is displayed as currency with two decimal places.
Power Table recalculates Royalty per Unit from the totals inside every pivot bucket. A United States row uses only United States Gross Royalties and Total Paid Units; a Paperback row uses only the paperback-format values contributing to that row. Parent totals are calculated from the complete parent totals rather than by averaging the child percentages or per-unit values.
For example, if one country earned $100.00 from 3 Total Paid Units, its Royalty per Unit is $33.33. Another country's result does not change that first country's calculation.
Add Royalty per Unit beside Total Gross Royalties and Total Paid Units when you want to compare how much each paid unit generated across countries, formats, titles, authors, or platforms.
Inorganic Orders %
Inorganic Orders % shows how much of the paid order total was attributed to advertising:
Ad Orders ÷ the greater of Ad Orders or paid Total Orders × 100
Paid Total Orders include paid ebooks (including imported pre-orders), paperbacks, expanded distribution, hardcovers, and audiobooks. Free Ebooks and Kindle Unlimited Borrows are excluded. Ad Orders are already part of Total Orders, so you should never add Ad Orders to Total Orders.
This matches the Total vs Inorganic Orders graph on Book Stats. If an advertising platform reports orders before the sales platform catches up, Ad Orders may temporarily be greater than the reported paid orders. In that case Power Table uses Ad Orders as the denominator and caps the displayed result at 100%.
A higher Inorganic Orders % means more of the reported paid-order total was attributed to advertising. It does not automatically mean the result was profitable. Add Ad Orders, Total Spending, Gross Royalties, Net Royalties, or ROAS when you also need to judge advertising efficiency.
Understand how a calculated value was produced
Calculated values have a subtle dotted highlight. Hover over one—or focus or click it on a keyboard or touch device—to open a calculation explanation.
The explanation shows:
- What the metric means.
- The formula Power Table uses.
- The exact inputs used for that row.
- The resulting value.
For example, opening Total Spending shows the AMZ Spend, FB Spend, BookBub Spend, and External Expenses from that exact row. Opening Royalty per Unit shows that row's Total Gross Royalties and Total Paid Units. Opening Inorganic Orders % shows Ad Orders and each paid-order component used by the formula.
The same behavior is available on supported header totals, ordinary rows, nested rows, and filtered totals. A country popover therefore explains the country calculation—not its parent book or the complete table.
Muted zero values do not open a calculation popover because there is no non-zero result to explain.
Power Table receives a compact, deduplicated set of calculation inputs with the visible grouped rows. It reuses one popover for the complete table and does not send a separate request for every cell or hover.
Make wide tables easier to read
Freeze the first columns
Select Freeze columns and choose how many leading columns should stay visible.
Freezing always works from left to right as one continuous range:
- Freeze the first column
- Freeze the first 2 columns
- Freeze the first 3 columns
- And so on
You cannot freeze a later column without freezing every column before it. This keeps row alignment correct while you scroll horizontally.
Change the table text size
Use the Text − / + controls to change table text from 80% to 150%.
- Select − for more columns on screen.
- Select + for easier reading.
- Select the percentage to reset to 100%.
The setting is saved in this browser and does not reload the data.
Use Compact mode
Keep Compact enabled to reduce row padding and fit more data on screen. Turn it off when you prefer more space between rows.
Show each value as a percentage of its total
Turn on Percentages above the table when you want to see how much each eligible metric contributes to the total for the same row. Power Table keeps the original value and adds the percentage beside it.
For example:
- If Total Gross Royalties are $100.00 and Ebook Royalties are $45.00, the Ebook Royalties cell shows $45.00 (45%).
- If Total Paid Units are 40 and Paperbacks are 10, the Paperbacks cell shows 10 (25%).
The comparison always uses the totals for the row you are reading:
| Metric | Percentage is based on |
|---|---|
| Paperback, Expanded Distribution, Hardcover, Paid Ebook, Audiobook, and Borrow counts | Total Paid Units in the same row |
| Paperback, Expanded Distribution, Hardcover, Ebook, Audiobook, KENP, All Stars Bonus, and Other Royalties | Total Gross Royalties in the same row |
| AMZ Spend, FB Spend, BookBub Spend, and External Expenses | Total Spending in the same row |
In the table body and footer, each percentage uses the same color as the underline beneath its 100% total value, making it easy to see which number is being used. Header percentages and totals keep the normal header styling without colored underlines. Hover over a percentage to see the total's name. If that total column is not selected, the percentage tooltip still identifies its basis.
This also applies to nested rows. For example, a country's Ebook Royalties percentage is calculated from that country's Total Gross Royalties—not from the parent book or the complete table.
Percentages are only added where a share of a total is meaningful. Spending breakdowns—AMZ Spend, FB Spend, BookBub Spend, and External Expenses—show their share of Total Spending. BSR, Number in Series, KENP Reads, Free Ebooks, total columns, impressions, clicks, Ad Orders, CPC, CTR, CPM, Cost per Ad Order, Ad Conversion Rate, and other advertising or rate metrics stay unchanged. KENP Royalties can show a royalty percentage even though the raw KENP Reads metric does not.
If the relevant total is zero, Power Table does not display a percentage for that cell.
Turning Percentages on or off is instant and does not reload the table. Sorting and downloads continue to use the original numeric values. Your current table and named saved layouts remember this setting.
Show book covers with titles
Select Cover + Book Title from the Attributes section. The cover and title share one column, so the cover does not take up a separate table column.
The cover is included automatically whenever Book Title is part of the layout. If a cover is unavailable in the authorized book metadata, Power Table shows its fallback image for that title.
Cover image URLs are never included in Flat CSV or Nested CSV downloads. Exports contain the book title as text so they remain clean and useful in spreadsheet tools.
Search and pagination
Use Search to find matching values in the selected attributes. For example, search for a title, author, tag, country, or platform that is part of the current layout.
Use Show entries to control how many top-level groups appear on each page. Nested rows belong to their parent group and do not create separate top-level pagination pages.
Download the table
Open Download and choose an export style:
Flat CSV
Choose Flat CSV when you want to analyze the data in Excel, Google Sheets, or another reporting tool.
- Produces one row for each final attribute combination.
- Repeats parent attributes on every applicable row.
- Works well for formulas, charts, filtering, and additional pivot tables.
Nested CSV
Choose Nested CSV when you want the export to preserve the Power Table hierarchy.
- Includes parent rows and their totals.
- Includes the nested breakdown rows.
- Works well for reviewing or sharing the same structure shown on screen.
BSR exports use readable text such as US: #30,000. When a row contains several marketplace pills, the exported cell lists each country and rank separated by a vertical bar. Country and Book Format export rows keep the same marketplace- and edition-specific BSR rules as the table.
Use Flat CSV for further analysis. Use Nested CSV when the hierarchy itself is important.
Practical table examples
Example 1: Find your strongest books
Attributes
- Book Title
- Book Format
Metrics
- Total Paid Units
- Total Gross Royalties
- Total Spending
- Total Net Royalties
Sort by Total Net Royalties from highest to lowest. This shows which books keep the most revenue after recorded spending.
Example 2: Review a pen name month by month
Attributes
- Author
- Book Title
- Month and Year
Metrics
- Total Paid Units
- KENP Reads
- Borrows
- Total Gross Royalties
Apply an Author filter first if you only want to review one pen name.
Example 3: Compare launch or catalogue tags
Attributes
- Book Tags
- Book Title
- Country
Metrics
- Total Paid Units
- Total Gross Royalties
- Total Net Royalties
This works well for tags such as Launch 2026, Backlist, Romance, or Needs Ads.
A book with multiple tags appears inside every applicable tag group. For example, a book tagged Launch 2026 and Romance contributes to both groups.
Do not add the tag rows together as if they were mutually exclusive. Power Table's overall and parent totals count the underlying book data once, but the individual tag groups intentionally overlap.
Example 4: Compare advertising efficiency
Attributes
- Book Title
- Platform
- Country
Metrics
- AMZ Spend
- FB Spend
- BookBub Spend
- Total Ad Impressions
- Total Ad Clicks
- Amazon Ad Clicks
- FB Ad Clicks
- BookBub Ad Clicks
- Ad Orders
- Inorganic Orders %
- Total CPC
- Amazon CPC
- FB CPC
- BookBub CPC
- Total CTR
- Cost per Ad Order
- Ad Conversion Rate
Use this table to compare advertising activity and efficiency across titles and markets.
Advertising values only appear when that advertising data is available and correctly associated with the relevant books. A muted zero means no matching value was found for that row and filter combination.
The Total advertising columns blend Amazon Ads, Meta/Facebook Ads, and BookBub Ads. You can also add the matching platform columns for a direct breakdown:
- Amazon Ad Impressions, Amazon Ad Clicks, Amazon CPC, Amazon CTR, and Amazon CPM
- FB Ad Impressions, FB Ad Clicks, FB CPC, FB CTR, and FB CPM
- BookBub Ad Impressions, BookBub Ad Clicks, BookBub CPC, BookBub CTR, and BookBub CPM
Power Table recalculates each rate from the totals in the current row or nested group. For example, Amazon CPC is AMZ Spend ÷ Amazon Ad Clicks. It does not average daily CPC values. Total CPC uses Amazon, Facebook, and BookBub advertising spend divided by Total Ad Clicks, so it is a true blended advertising rate. Featured Deal fees and External Expenses are included in Total Spending but are not included in CPC, CPM, or Cost per Ad Order because they do not provide ad clicks, impressions, or orders.
Example 5: Compare sales platforms and expenses
Attributes
- Platform
- Country
- Book Format
Metrics
- Total Gross Royalties
- AMZ Spend
- FB Spend
- BookBub Spend
- External Expenses
- Total Spending
- Total Net Royalties
This is useful when you sell through several stores or record external royalties and expenses.
Example 6: Review multiple Shared Access accounts
Attributes
- Account
- Author
- Book Title
Metrics
- Total Paid Units
- Total Gross Royalties
- Total Spending
- Total Net Royalties
Select the accounts at the top of the page before building the table. Only accounts and books you are permitted to view are included.
Example 7: Review series progression
Attributes
- Series
- Book Title
- Country
Metrics
- Number in Series
- Total Paid Units
- Sell-Through
- KENP Reads
- Read-Through
- Listen-Through
- Royalties per Reader
- RPR Contribution
- Total Gross Royalties
Sort Number in Series from lowest to highest. Start with countries collapsed to review the complete series, then expand a title or country when you want to understand a regional difference. Use Royalties per Reader on the series row and RPR Contribution on title rows. Toggle Include free ebooks to compare paid-only Sell-Through and RPR with a launch or promotion that distributed free copies.
Example 8: Compare profitability
Attributes
- Book Title
- Platform
Metrics
- Total Gross Royalties
- Total Spending
- Total Net Royalties
- ROI
- ROAS
Sort by ROI or ROAS to compare efficiency, but keep the underlying royalty and spending columns visible. A high ratio based on very little spending may not represent the largest absolute return.
Example 9: Review current BSR by country and format
Attributes
- Book Title
- Country
- Book Format
Metrics
- BSR
- Total Paid Units
- Total Gross Royalties
Sort BSR from lowest to highest. Keep countries collapsed when you want one yellow pill per available marketplace, then expand Country and Book Format to see the rank for each exact edition.
Remember that BSR is current metadata while units and royalties follow the selected Time Period. Use them together to compare the current rank with recent performance, but do not describe BSR as a historical rank for the selected dates.
Tips for reliable comparisons
- Compare like with like: use the same date range and filters when comparing two layouts.
- Put time attributes near the end unless the main purpose is a timeline.
- Start with four or five metrics, then add more only when they answer a specific question.
- Use Total Net Royalties for profitability and Total Gross Royalties for revenue before spending.
- Keep Total Gross Royalties and Total Spending visible when comparing ROI or ROAS.
- Expect Sell-Through and Read-Through to change when you add Country, Platform, Book Format, or another breakdown; each row uses its own filtered bucket.
- Treat BSR as current metadata, not as a rank calculated for the selected date range.
- Add Country and Book Format when you need to verify the BSR for one exact marketplace and edition.
- Use Month and Year instead of separate Month and Year columns when you need a chronological monthly view.
- Freeze only the identifying columns you need; freezing too many leaves less room for metrics.
- Use muted zero values to scan past groups with no activity.
- Download a Flat CSV when you need calculations that are not part of Power Table.
Common questions
Why did the table change after I reordered attributes?
Attribute order defines the hierarchy. Moving Country before Book Title answers a different question from moving Book Title before Country.
Why does one book appear under several tags?
Book Tags are multi-value attributes. A book appears under every tag assigned to it. Overall totals still count the underlying data once.
Why do I not see the Account attribute?
Account is only shown to users with Shared Access. The selected shared accounts and their permission rules also control which data can appear.
Why is a cover missing?
The book may not have a cover stored in the authorized metadata, or the table may not include Cover + Book Title.
Why are some advertising values zero?
There may be no ad activity for that row, or the campaign data may not be associated with the selected book and filters.
Why can Sell-Through, Read-Through, or Listen-Through be higher than 100%?
These metrics compare the current series position with the preceding applicable position and are not capped. A percentage over 100% means the current book recorded more eligible units, estimated full reads, or audiobook units than the previous applicable edition for the same filters and table bucket.
Why does Sell-Through change when I use Include free ebooks?
The toggle controls whether free ebook units are added to both books' eligible units. It does not affect Read-Through, royalties, audiobooks, KENP pages, or the original paid-unit columns.
Why is Number in Series blank in the totals row?
Series position is descriptive and cannot be meaningfully added or averaged across books. Power Table displays it on book rows but intentionally leaves its header and footer totals blank.
Why does BSR show several yellow pills?
Country is not currently part of that row's hierarchy, so Power Table shows the latest available rank for each marketplace in one cell. Add Country as an attribute to display one marketplace rank per Country row.
Why does BSR change when I expand Book Format?
Different formats commonly use different ASINs and therefore have different Amazon ranks. Power Table uses the exact ebook, paperback, or hardcover ASIN contributing to each Book Format row; it does not copy one format's BSR to another.
Why does BSR not follow my selected date range?
BSR is the latest rank recorded in Publisher Champ rather than a historical sales metric. The Time Period still controls the sales, royalty, advertising, and expense rows around it.
Why is BSR blank in the totals row?
Amazon ranks cannot be meaningfully added or averaged. Power Table displays BSR on applicable data rows and intentionally leaves its header and footer totals blank.
Why are ROI and ROAS zero when royalties are present?
Both metrics require a non-zero Total Spending value. When the matching row has no recorded AMZ Spend, FB Spend, BookBub Spend, or External Expenses, Power Table returns zero instead of dividing by zero.
Why does a zero value not show a calculation explanation?
Calculation popovers are intentionally available only for non-zero values. Zero values keep their muted table styling without adding an unnecessary popover.
Does Power Table send every transaction to my browser?
No. Power Table groups, filters, sorts, and paginates data on the server. The browser receives the grouped rows needed for the current table.
Will my layout remain after refreshing?
Yes. Named layouts are saved to your Publisher Champ account and can be used on your other devices. The current unsaved table, Compact preference, Percentages preference, frozen-column count, and text size are remembered locally in the current browser. Raw performance data are never stored in browser local storage.
Sort books by ratings
Add Total Ratings and Average Rating from the column picker, then click either column header to sort ascending or descending. Use Book Title or Book ID / ASIN as a row dimension. Save the layout to reuse your ratings report. MCP clients can request the same measures as total_ratings and overall_rating and use either as sort_by.
Ratings are the latest saved primary ratings from your bookshelf, not ratings gained during the selected dates or ratings specific to the selected country. Only books represented in the filtered report data appear. Each title and author is counted once per account and platform in each group, across all formats. For example, an ebook, paperback, and hardcover with 15 ratings each contribute 15 ratings together. If the saved counts differ, the highest count is used with its matching average rating. Group averages are weighted by rating count; books without a known rating are excluded from that average. Missing values display as zero. Individual format rows can show the same shared count; grouped totals count it only once.